From the Lab
A Closer Look at Mask Shapes and Heap Sizes
Bernard Llanos — July 8, 2013 - 2:05pm
Background
Parallel computation is a possible way to increase the speed of the cumulative range geodesic filter. However, calculating the filtered value of many pixels simultaneously means that memory needs to be allocated for the working data of multiple pixels at once, potentially increasing memory usage significantly.
In order to find an upper bound on the memory needed to filter a single pixel, it is necessary to examine the number of neighbouring pixels involved in the filtering process.
Note: The plots in this post were produced with a variant of the cumulative range geodesic filtering program which does not permit the incremental cost of adding a pixel to the mask to fall below 1 (values less than 1 are set equal to 1). This change is intended to prevent filtering masks from becoming arbitrarily thin in image regions with no colour variation.
Part 1 - Analyzing Filtering Mask Shapes
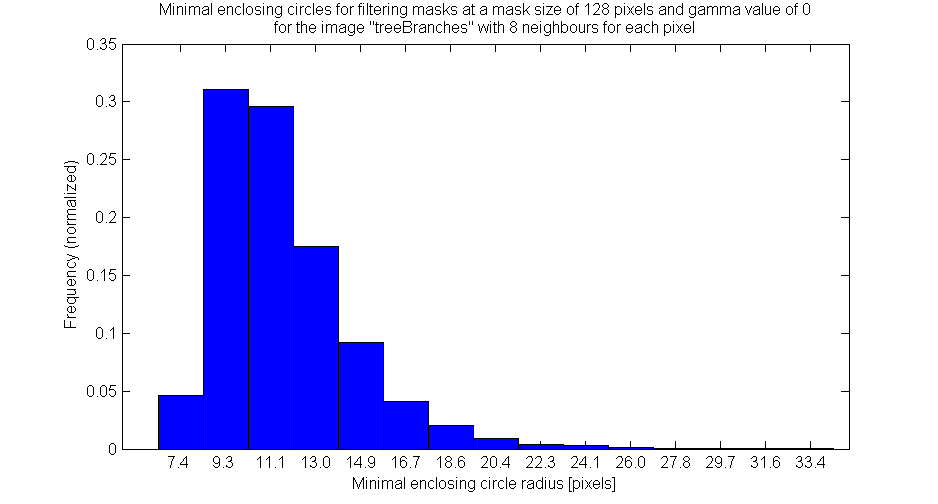
The region of the image which the current pixel's filtering process can access must be sufficiently large to accommodate the entire filtering mask. The upper bound on the length of the mask is equal to the number of pixels in the mask and occurs if the mask forms a straight line. However, most pixels will probably not have masks which are almost linear in shape. Testing this hypothesis resulted in the following two figures:
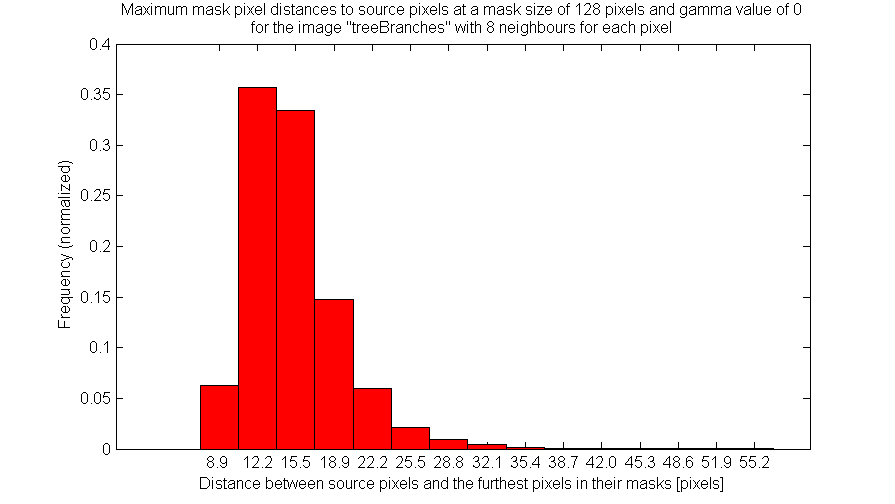
The first figure shown above describes the probability associated with values of the furthest distance from the source pixel to another pixel in its filtering mask. Very few pixels have masks which extend to distances beyond a third of the mask size.
The second figure describes the probability associated with values of the radius of the minimal enclosing circle corresponding to the a filtering mask. The minimal enclosing circle is the smallest circle which can contain all pixels in the mask. This measurement of mask shape is less useful than the maximum distance from the source pixel for the purposes of determining the size of the region surrounding the source pixel. However, it provides a more accurate description of the actual size of the mask, since the source pixel is rarely centered in the mask.
Part 2 - Analyzing Filtering Heap Sizes
During filtering, the heap keeps track of the pixels which lie along the borders of the mask. The size of the heap is important for determining both the speed of the filter (refer to a previous post at http://gigl.scs.carleton.ca/node/496) and the amount of memory required for filtering each pixel. A preliminary look at the size of the heap at the end of the mask building process showed considerable room for improvement:
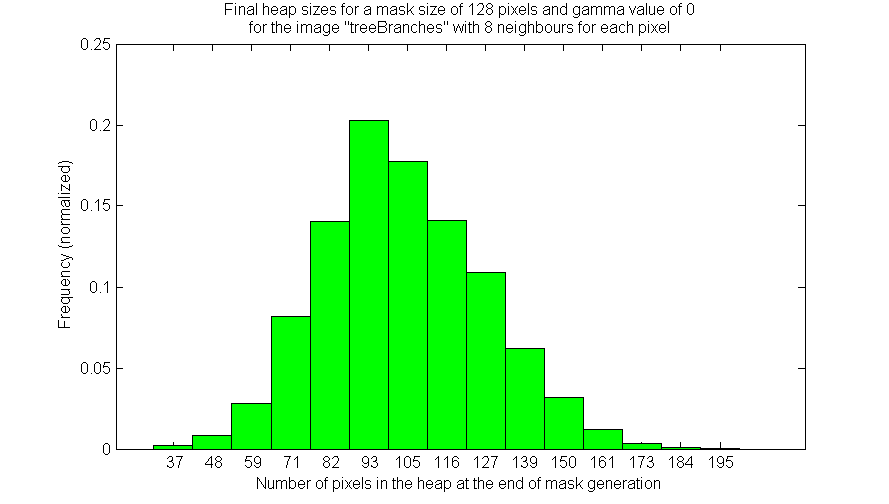
As shown above, once the mask is completed, there are on average around 100 unused pixels remaining in the heap for a mask size of 128 pixels. The number of pixels which are actually needed in the heap is equal to the number of pixels which have yet to be added to the mask.
Unfortunately, taking advantage of the relatively small number of pixels needed for the mask to implement a constant or decreasing heap size introduces some additional complexity and may slow down the filtering process. In order to examine adjacent pixels without increasing the size of the heap, it is necessary to insert pixels into the heap only when they are less than the pixel of maximum distance currently in the heap. Furthermore, each newly inserted pixel must overwrite the current maximum-distance pixel. Finding the maximum distance pixel can be a very slow process, depending on how the pixels are organized in the heap. Solutions such as creating a second heap for efficient retrieval of the maximum-distance pixel would potentially improve filtering speed, but at the cost of increased memory usage.
Below are a couple of figures which show the distribution of maximum heap sizes during filtering, if the heap size was limited to the number of pixels yet to be added to the mask. Since the number of pixels to be added to the mask decreases linearly with the number of pixels already in the mask, the shapes in the two contour plots have clean upper edges which slope downwards to the right. The first figure is coloured to show the probability of needing a certain heap size, while the second figure is coloured to show the probability that the maximum heap size will occur when a given number of pixels are present in the mask.
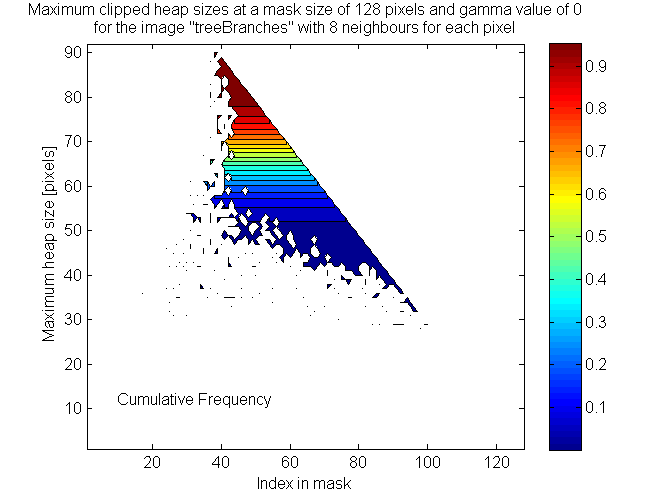
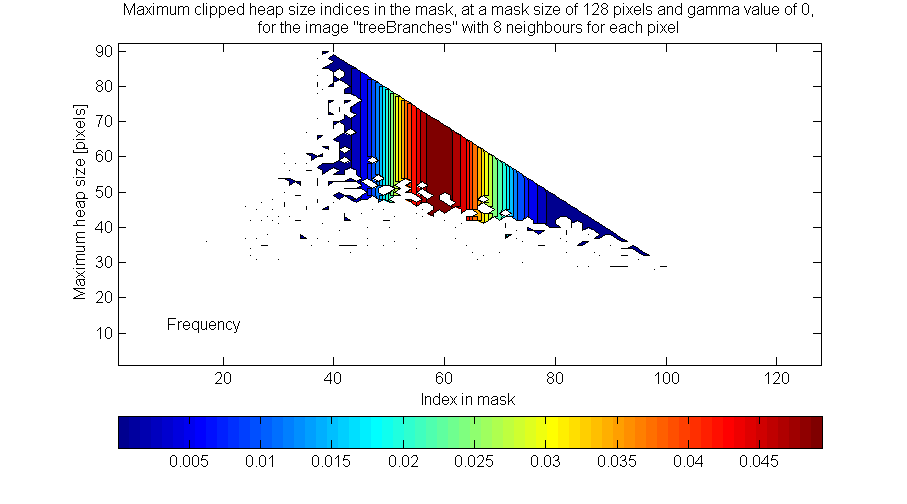
Therefore, it seems that controlling the size of the heap in this way reduces the maximum size of the heap to less than 60% of the number of pixels in the mask, approximately 80% of the time. The point at which the heap reaches its maximum size is approximately at the midpoint of the mask generation process.
Variability of the Results
I observed that the data shown above does not change significantly with the different textures and shapes of ordinary photographs. In general, the trends shown above should apply to all source images except perhaps highly non-representational images such as noise patterns, repeating geometric patterns, or images with only very simple shapes and few colours.
In contrast, changing the mask size may have a more pronounced effect on the distributions shown above. In an earlier test, using a filter which did not enforce minimum incremental distances of 1 (although this is likely not significant), filtering with a large mask size seemed to produce more uniform (flattened) frequency distributions than filtering with a small mask size. The trends in the data did not change, however. Perhaps further investigation of this effect should be conducted in the future.
Finally, changing the graph model of the image from a 4-neighbour to an 8-neighbour configuration significantly increased the size of the heap (both the final size of an unbounded heap, and the maximum size of a bounded heap). Increasing the number of neighbours in the graph model also had some flattening effect on the distributions of mask shapes (maximum distances to the source pixel and radii of minimal enclosing circles).
Further analysis of mask size variation effects
Bernard Llanos — July 10, 2013 - 1:30pmI reproduced the results shown in this post for mask sizes of 200, 400 and 800 pixels with three different images. For this range of mask sizes, it seems that increasing the mask size has little effect on the shapes of the frequency distributions shown above.